How to Read a Trading Dashboard With Confidence
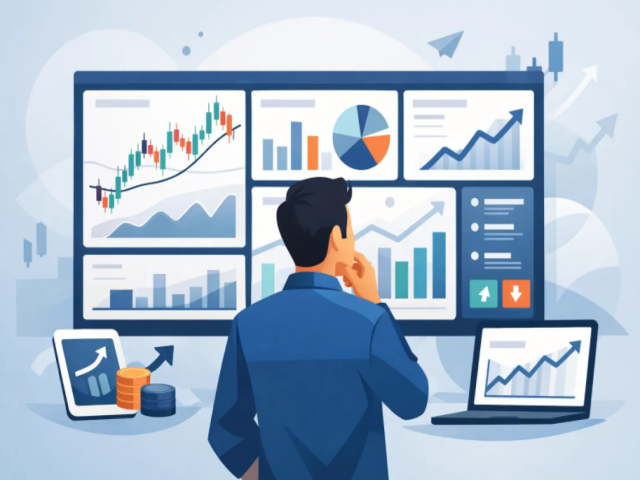
Learn how to read a trading dashboard, track your balance, profits, market exposure, and withdrawals, and make clearer choices about your investment goals.
A trading dashboard should give you a clear view of your money in seconds, not leave you guessing what each number means. Learning how to read a trading dashboard helps you follow your investment progress, understand your market exposure, and stay focused on the financial goals that brought you to managed investing in the first place.
For investors who want passive income without spending every day studying charts, the dashboard is the center of the experience. It turns activity across global markets into a simple, visible picture of your account. The key is knowing which figures deserve your attention and which ones need time and context.
How to Read a Trading Dashboard: Start With Account Value
Your account value, sometimes called total balance, equity, or portfolio value, is the broadest number on the screen. It represents the current value of the funds held in your account, including deposited capital and, depending on the platform, profits or losses from active market positions.
Do not confuse account value with cash available to withdraw. Part of your balance may be allocated to an active investment program or open market exposure. If the dashboard separates these figures, review them together: total balance shows your overall position, while available balance shows the amount currently uncommitted and potentially available for a new allocation or withdrawal.
A growing account value can be encouraging, but one day does not define the quality of an investment strategy. Equities, currencies, crypto assets, indices, and commodities move at different speeds. Short-term changes are normal, especially when a portfolio includes markets that trade around the clock.
Separate Deposits, Profit, and Available Funds
The fastest way to read your results accurately is to separate your original capital from performance.
Your deposit history shows the money you have added to the account. This is your contribution, not investment profit. Your profit and loss section shows how the investment activity has performed over a selected period, such as today, this week, this month, or since the beginning of an investment plan.
Available funds are different again. They usually refer to the portion of your balance that is not currently committed to an active plan, pending transaction, or open position. If you are planning a withdrawal, this is the number to check alongside the withdrawal status and any plan terms that apply to your account.
This distinction matters because it keeps expectations realistic. A dashboard can show a positive total return while some funds remain allocated for a defined term. It can also show a temporary decrease in market value without meaning that your initial deposit has disappeared. Read the labels carefully rather than relying on one headline number.
Understand Profit and Loss Without Overreacting
Profit and loss, often shortened to P&L, shows whether an investment position or portfolio has gained or lost value. A green figure generally indicates a gain. A red figure generally indicates a loss. The percentage beside the dollar amount gives useful context because a $100 movement means something very different in a $1,000 account than in a $100,000 account.
Pay close attention to the time period attached to the P&L figure. Daily P&L reflects short-term market movement. Monthly or plan-based performance provides a wider view. Lifetime profit can be useful for measuring progress since your first deposit, but it should not be used alone to decide whether your current allocation fits your needs.
Managed investing is designed to reduce the burden of day-to-day trading decisions, not eliminate market movement. There may be periods when values move slowly or temporarily decline while analysts manage exposure across changing conditions. The better question is not simply, “Did the balance move today?” It is, “Does my portfolio progress still align with my time horizon, risk comfort, and income objectives?”
Read Your Active Investments and Market Exposure
The active investments section shows where your funds are currently working. Depending on the platform and program, you may see an investment plan, entry date, amount invested, current value, estimated return information, maturity date, or status.
This area gives you visibility into the structure of your investment. A short-term allocation may suit an investor who wants more frequent access to funds. A longer-term program may be better for someone building wealth toward a future purchase, retirement planning, or business capital goals. Neither option is automatically better. The right fit depends on when you may need the money and how much short-term fluctuation you are comfortable seeing.
If the dashboard displays asset categories, use them to understand diversification. Exposure to equities may respond to company earnings and economic conditions. Currency markets can react quickly to interest rates and global events. Crypto assets may bring larger price swings, while commodities and indices add other sources of opportunity and risk.
Diversification does not guarantee a profit or prevent losses. It does, however, help you see whether your account relies too heavily on one market type. A balanced view of exposure is more useful than chasing whichever asset performed best this week.
Open Positions Versus Completed Trades
An open position is still active. Its value may rise or fall as market prices change, and its displayed profit or loss can change until the position is closed. A completed trade has been closed, making its recorded gain or loss part of your account history.
For a passive investor, this difference prevents unnecessary concern. Open positions reflect active management in progress. Completed trades tell you what has already been realized. Review both, but do not treat an open P&L figure as a final outcome.
Use the Transaction History as Your Record
The transaction history is one of the most practical parts of a trading dashboard. It should show deposits, withdrawals, profits credited, transfers, investment allocations, and transaction statuses. This is where transparency becomes tangible.
When reviewing a transaction, check the date, amount, transaction type, and status. A pending transaction may require processing time, verification, or blockchain confirmation if crypto is used for funding. A completed transaction indicates that it has been processed. If something looks unfamiliar, compare it with your recent activity before taking action.
Keeping an eye on this record also makes personal planning easier. You can see how much you have contributed over time, which funding methods you have used, and when profits or withdrawals were processed. For business or entity investors, accurate records can also support internal accounting and cash-flow decisions.
Set the Right Dashboard View for Your Goal
Most dashboards allow you to filter by date range, asset, investment plan, or transaction type. These tools are not just decorative. They help you ask better questions.
If your goal is short-term cash flow, review available funds, withdrawal activity, and upcoming plan dates. If you are building long-term wealth, compare broader performance periods and track your total contributions against portfolio growth. If you are adding crypto funding, review confirmations carefully and ensure the wallet details and amounts match your intended transaction.
Avoid checking the dashboard compulsively. Daily visibility is useful, but frequent monitoring can turn ordinary market movement into stress. A practical routine is to review account activity after deposits or withdrawals, check performance on a consistent schedule, and revisit your investment horizon whenever your personal finances change.
Watch for the Details That Protect Your Account
A clear dashboard supports better decisions, but account security still starts with you. Use a unique password, protect your login credentials, and confirm that every deposit or withdrawal request is yours. Never make financial decisions based on unsolicited messages that pressure you to act quickly.
Also remember that a dashboard is a reporting tool, not a promise of future returns. Past performance, displayed gains, and market commentary can help you understand activity, but financial markets carry risk. Only invest funds that fit your own circumstances and time horizon.
A well-read dashboard gives you something more valuable than a stream of numbers: perspective. When you can distinguish capital from profit, active exposure from available funds, and daily movement from long-term progress, you can stay connected to your investment without being consumed by the work of trading it yourself.
Recent Posts
-

Guide to Economic Indicators for Investors
22 Oct 2026
-

Retirement Portfolio Diversification Example
22 Oct 2026
-
When Portfolios Rebalance and Why It Matters
22 Oct 2026
-
How to Rebalance a Multi Asset Portfolio
22 Oct 2026
-
How to Protect Investment Accounts From Fraud
22 Oct 2026
-
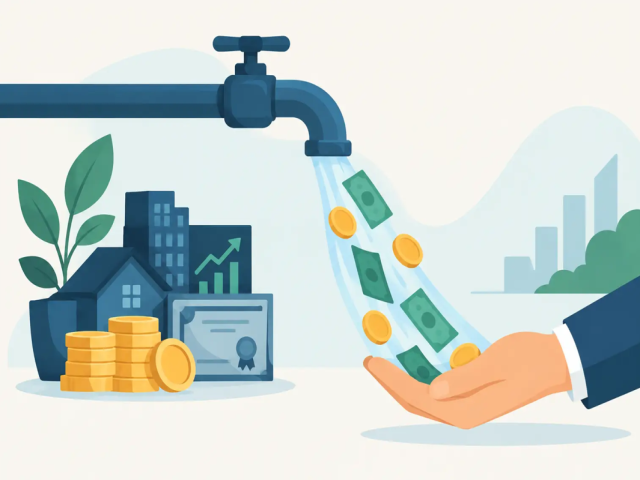
What Is Investment Liquidity and Why It Matters
20 Oct 2026
-

How to Set Financial Goals That Build Wealth
20 Oct 2026
-

Robo Advisors Versus Brokers for Your Goals
20 Oct 2026
-

-

-
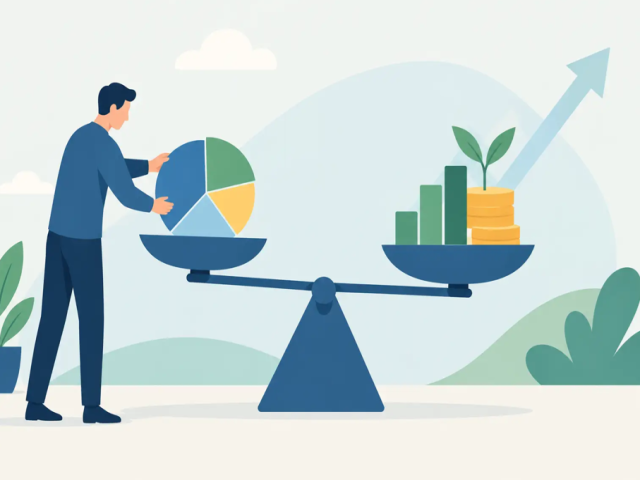
When Should Portfolios Rebalance for Growth?
08 Oct 2026
-
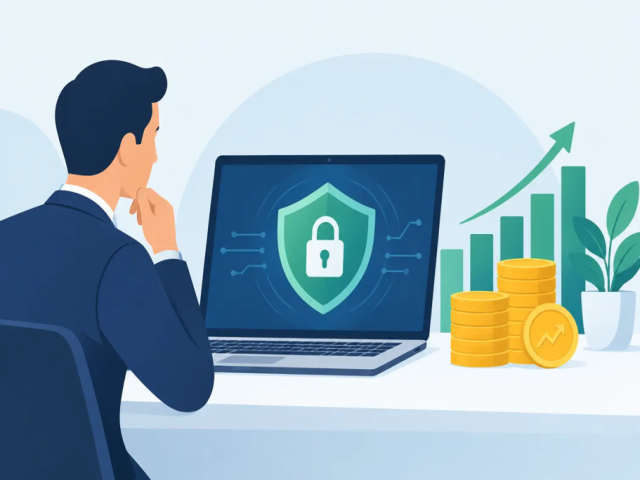
Platform Security Review for Confident Investors
08 Oct 2026
-

How to Invest Business Cash Reserves Wisely
08 Oct 2026
-
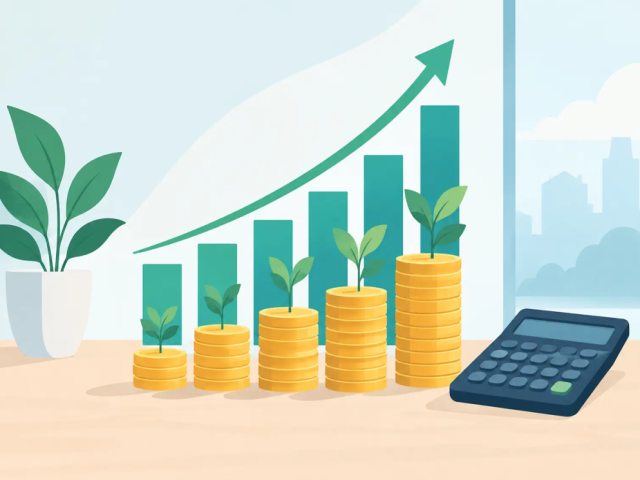
How to Calculate Compound Returns on Investments
08 Oct 2026
-

Alternative Assets Trends Reshaping Portfolios
08 Oct 2026